Math 12—Precalculus—Chapter 2 Test Solutions
1. Consider the following equations relating x and y :
|
a. |
b. |
|
c. |
|
2. Let and
a. What
is the domain of f ?
b. What
is the domain of g ?
c.
d. What
is the domain of ?
Viewing this last relation as quadratic in x, we require that its discriminant is
non-negative:
that is, with we require that ,
so ,
which is in the domain of f, so the
domain of is .
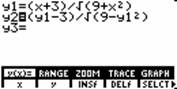
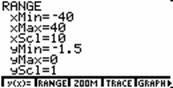
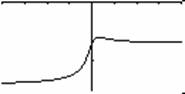
To illustrate, on the TI85, we can define the composition as y2 as shown in the first screen below, then
capture the function’s curve over -40<x<40. You can see that as y1 approaches
-1.4, y2 approaches (asymptotically to the left) -4.4/sqrt(7) ~ -1.66 and as y1
approaches 1.4, y2 approaches
(asymptotically to the right) -1.6/sqrt(7) ~ -0.6. Thus the function has two horizontal
asymptotes, one to the left and one to the right, as shown below.
|
|
|
|
3. Suppose the rate, R, of population growth is jointly proportional to the present population size, p, and the amount by which that size falls short of the carrying capacity C – p.
a. Assuming the constant of proportionality
is k, write an equation relating R to p. This equation will also involve the
parameters C and k.
b. Suppose the carrying capacity is C = 1000 and a polution of p = 800 yields a population growth rate R = 3%.
What is the value of k? What will the growth rate be if p = 500?
4. Find
the average rate of change of the function
over the interval .
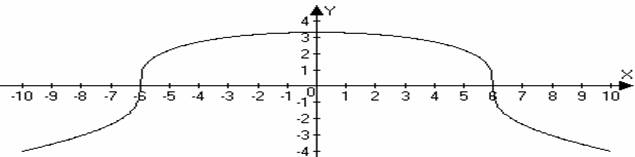
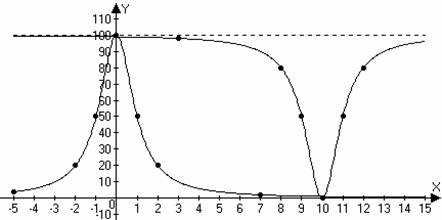
5. Consider the function .
a. Make a table of values and sketch a graph of this function.
|
|
|
|
b. The table for can be found by adding 10 to all the x values and subtracting the corresponding y values from 100 (at right). Note in the graph that the curve is flipped vertically, the horizontal asymptote asymptote is shifted up 100 and the line of symmetry is shifted 10 to the right. The graph is shown together with the graph of f above. |
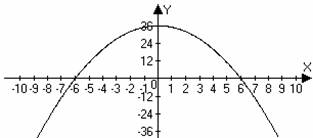
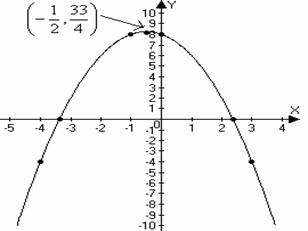
6. Consider
a.
Write the function in vertex form.
b. Sketch
a graph for the function showing the coordinates of the vertex and all
intercepts.
|
c. |
|
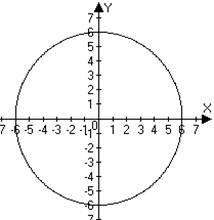
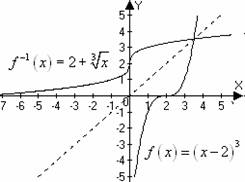
7. Find the inverse function for and sketch a graph of f and its inverse together, showing the symmetry through the line y = x.
|
|
|
|
|
|
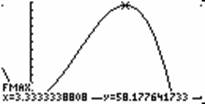
8. Suppose
the sum of the height of a circular cylinder with the radius of its base is 5
units. What is its maximum volume?